
Which statistics matter the most in Fantasy?
and why Jacob Kiraz scores better than Sunia Turuva

Without looking at the numbers, most Fantasy coaches would instinctively think of tackles, run metres, tries, try assists, and tackle breaks as contributing heavily to total Fantasy points scored across the NRL. Like a lot of things, the reality is close, but slightly different.
The following graph shows the total number of Fantasy points scored, broken up by individual statistics.*
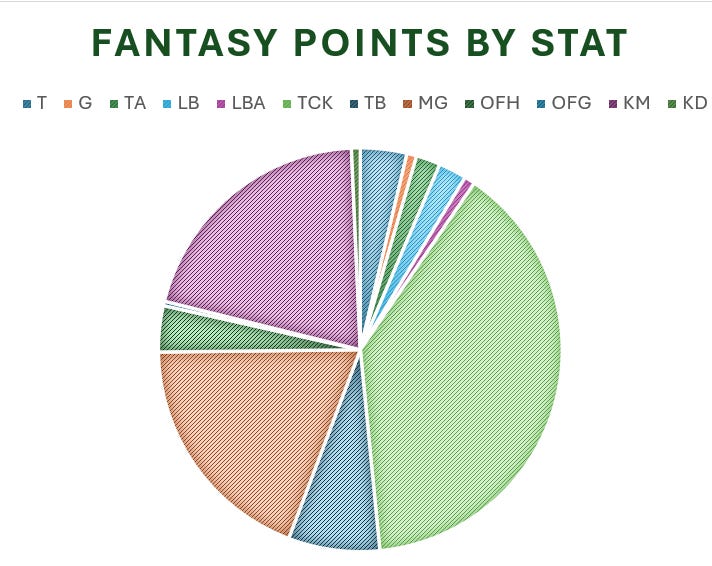
* Field goals, turnovers, try saves, 40/20s, 20/40s, forced dropouts, and escapes from in-goal are relatively insignificant and are not featured.
Presented another way, the statistics line up like this:
1. Tackles - 102,207 Fantasy points
2. Kick metres - 53,673
3. Metres gained - 50,042.2
4. Tackle breaks - 19,238
5. Tries - 9,784
6. Offloads to hand - 9,712
7. Line breaks - 5,904
8. Try assists - 5,105
9. Line break assists - 2,268
10. Goals - 2,058
11. Kick defusals - 1,853
12. Offloads to ground - 930
Unsurprisingly, tackles lead from the front by a long way. We also see kick metres and metres gained as the next most significant categories and then tackle breaks. The balance of the attacking stats range from just under 10,000 down to 930.
Interestingly, offloads are more significant than tries when combined. Joining offloads to hand and offloads to ground gives us 10,642 Fantasy points from all offloads this season, roughly 850 more than tries.
These results make sense when compared against the game’s top scorers.
Nathan Cleary typically gains Fantasy points from a variety of categories (an article in itself), including by producing plenty of kick metres, along with a healthy amount of run metres (avg 97) and tackles (avg 20). Similarly, Terrell May is big on tackles, run metres, and offloads. Players like Herbie Farnworth are heavy on offloads, run metres, tackle breaks, and tries. High minute middle forwards are generally very valuable in Fantasy. The proof is in the pudding.
Which stats punch above their weight?
We can probably assume that Fantasy scoring has been designed to produce a balanced rate of scoring across the field. What forwards lack in tries, try assists, line breaks, etc., they can make up for in tackles, run metres, and offloads.
To achieve this, Fantasy points appear to be weighted against the rarity of the statistic they are connected to (makes sense). Run metres are plentiful, so they are awarded only one point per ten metres gained. Tries are harder to come by, so they are awarded eight points (nothing surprising here).
We can get a better understanding of how certain statistics are valued in Fantasy by comparing individual stats against the total of statistically relevant actions that generate, or contribute to, Fantasy scoring. That is, if we add the total number of tries, the total number of run metres, the total number of tackles, and so on, how frequent are tries compared to tackle breaks? For the sake of clarity, let’s call each of these actions (tries, tackles, etc.) ‘events’.
The answers will be obvious but is important to what we discuss next. Following is a ranking of the most frequent Fantasy relevant events, as a percentage:
Frequency of Events
1. Metres gained - 62.41% of total events
2. Kick metres - 22.31%
3. Tackles - 12.75%
4. Tackle breaks - 1.20%
5. Offloads to hand - 0.30%
6. Kick defuse - 0.23%
7. Line breaks - 0.18%
8. Try - 0.15%
9. Line break assists - 0.14%
10. Goal - 0.13%
11. Try assists - 0.13%
12. Offloads to ground - 0.06%
13. Field goals - 0.002%
To no one’s surprise, metres gained, kick metres, and tackles are the most frequent. However, we can then also consider how each statistical category / event contributes to Fantasy points scored overall:
Contribution to Fantasy Points Scored
1. Tackles - 38.88% of total Fantasy points scored
2. Kick metres - 20.42%
3. Metres gained - 19.04%
4. Tackle breaks - 7.32%
5. Try - 3.72%
6. Offloads to hand - 3.69%
7. Line breaks - 2.25%
8. Try assists - 1.94%
9. Line break assists - 0.86%
10. Goal - 0.78%
11. Kick defuse - 0.70%
12. Offloads to ground - 0.35%
13. Field goals - 0.04%
To get an idea of how statistics are valued by Fantasy, we can then work out the ratio of the frequency of Fantasy-relevant events against how the event contributes to Fantasy scoring. We get the following, ordered from highest ratio to lowest:
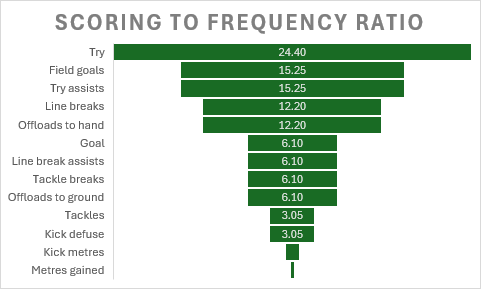
It isn’t shown on the above graph, but kick metres have a ratio of 0.92 and run metres 0.31.
The higher the ratio, the higher the value of points compared to the frequency of the statistic. A ratio of one would reflect a balance between scoring and frequency.
Tries are the most overvalued. This makes sense as they account for only 0.15% of total statistics accrued but contribute to 3.72% of Fantasy points scored. Each try is worth three points more than the next highest scoring play. They are also the highlight of the entire sport, so should be rewarded appropriately.
We then see that field goals, try assists, line break assists, and offloads to hand are also overvalued.
Metres gained is the most undervalued of all, contributing to 62.4% of all statistics recorded, but only 19% of the points. Considering metres can flow with little effort, it makes sense for Fantasy not to overvalue them.
Kick metres are the closest to even. This is likely because, although kick metres are easily accrued by halves, only a relatively small percentage of players regularly kick the ball.
Tackles are interesting. They’re the second-most frequent event (12.75% of all events) and contribute the highest share of total points (38.88%), with a ratio of only 3.05. This occurs because the sheer volume of tackles (102,207 total) accumulates massive points despite a low per-event value (one point each).
Summing up
There is nothing groundbreaking in any of this. Of course Fantasy rewards rarer events more highly than high-volume events. Tries should be worth 8x more than tackles; there is nothing controversial there.
What can be taken away from this though is the importance of statistics like offloads. Offloads (both to hand and to ground) generating more points in Fantasy overall than tries is helpful to know. While tries will always reign supreme, a solid player who can consistently find a few offloads a game is going to be more valuable than a solid player who can find a try every now and then.
A great example of this is Jacob Kiraz compared with Sunia Turuva. Both players produce similar amounts of run metres and tackle breaks, but Turuva scores more tries. Yet Kiraz has a Fantasy average of 45.6 and Turuva has an average of 34.7. Why? Offloads. Kiraz averages 2.7 offloads to hand per game and 2.3 to ground. Turuva averages less than 0.5 for both.
For the same reason, the season leaders in offloads are all mostly Fantasy relevant players, yet the season leaders for tries are a mixed bag of relevant and non-relevant.
Next time a player debuts from reserve grade, it might be worth checking out their offload numbers.